Suppose you route decisions on a model's confidence: accept everything above 90%, send the rest to a person. That policy only works if "90%" means something. Jev returns a confidence with its answers, and in our last article we said the way to find out is to test it against labeled data. So we did.
The short version: Jev's confidence is useful, but out of the box it ran up to 15 points overconfident, and it isn't a probability of being right until you calibrate it against your own labels. A calibration step closes most of that gap. The way you set up the question in the request changes what the raw numbers look like, too.
This is the same problem behind every confidence-gated system: the model hands you a number, and only your own reviewers can tell you what that number is worth. Calibrating it means labeling a few hundred of your own verdicts, agree or disagree, and fitting a curve to what your reviewers actually did. Once the number matches what your reviewers found, you can set a real threshold, auto-accept above it, and route everything else to a person. That calibration loop costs far less than building a labeled dataset before you ever start classifying.

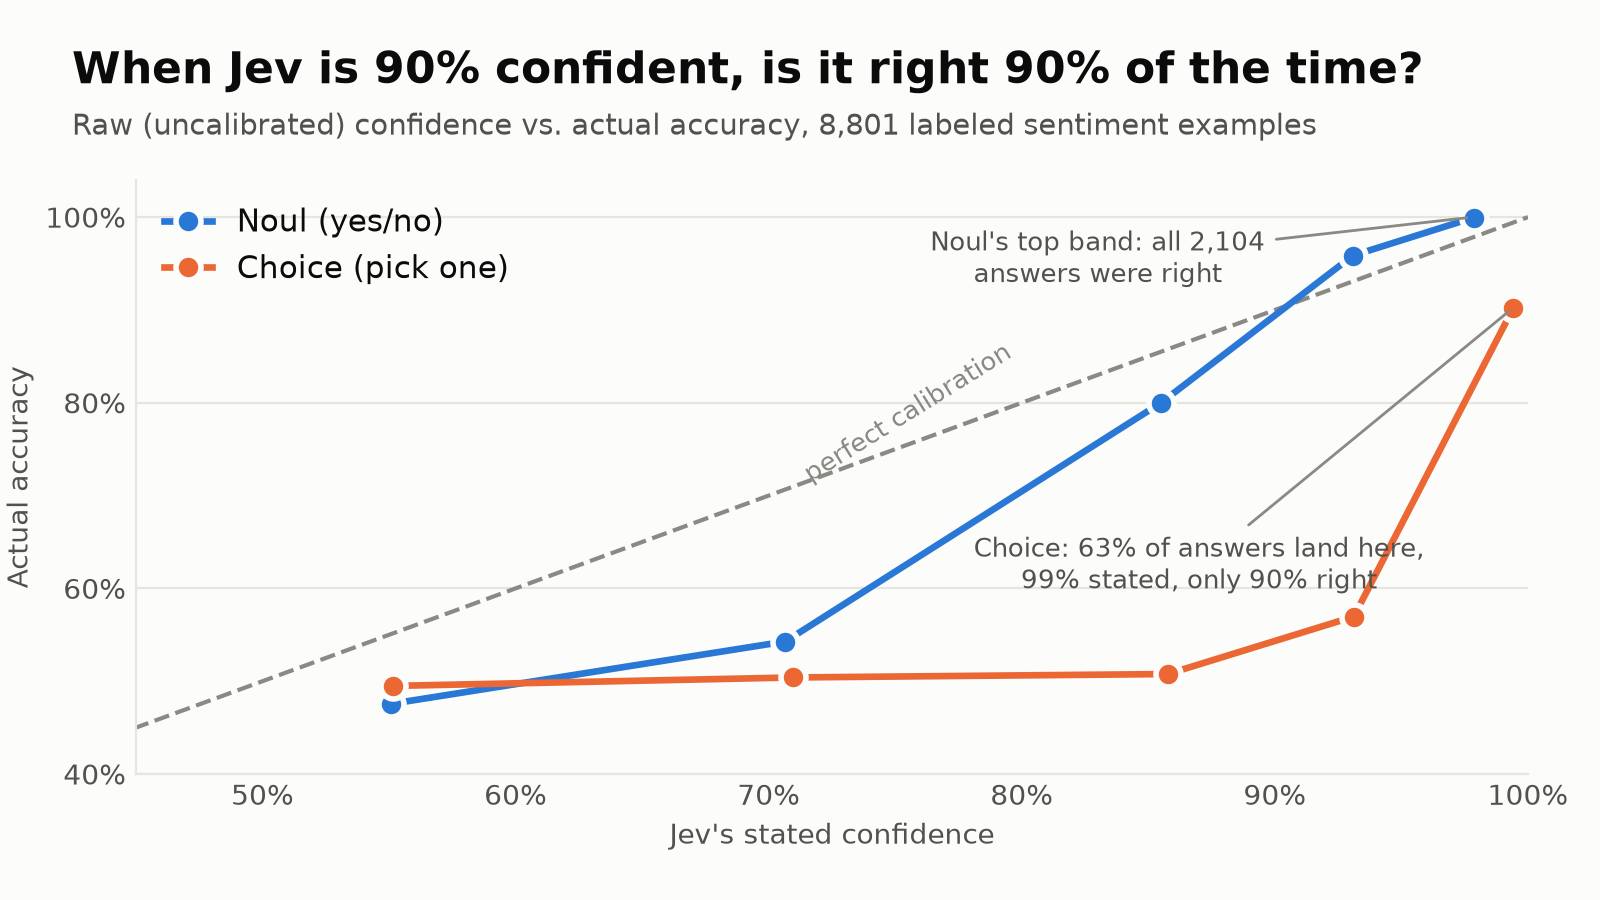
The same sentiment task, asked two ways. Stated confidence runs along the bottom; how often Jev was actually right runs up the side. A perfectly calibrated model would sit on the dashed diagonal.
Three words that get mixed up
- Accuracy is measured. It's the share of predictions that agreed with the ground-truth labels, over some set of examples.
- Confidence belongs to a single prediction. It's how strongly the model favors the answer it gave: the probability it assigns to that answer. On its own it says nothing about whether the answer is right.
- Calibration is how well the two line up. Among predictions made with about 90% confidence, is accuracy about 90%? Expected calibration error (ECE) is the average gap between stated confidence and observed accuracy, and it's the number we'll keep coming back to.
A model can be accurate and badly calibrated, or well calibrated and not very accurate. Routing decisions on confidence needs the second property.
The experiment
We reused the 10,000-line sentiment dataset from our earlier confidence-from-a-fine-tuned-classifier work. After dropping exact repeats it's 8,801 examples in four tiers of difficulty: strong, medium, weak, and neutral. The neutral tier has deliberately arbitrary labels (2,000 of the examples), so about 50% accuracy there is the correct result, and we report the numbers with and without it. We split the examples 60/40 into a calibration set (5,280) and an untouched test set (3,521).
Jev's interface takes some text and a set of typed questions. We used two of its question types for the main comparison:
- Noul, a yes/no question that returns the probability of yes. Ours was "Is the overall sentiment of this text positive?"
- Choice, which picks one option and returns a probability for each. Ours chose between
positiveandnegative.
We also asked six other versions of the question, covering wording, polarity, option order, option descriptions, an extra "neutral" option, and a five-level Score rubric. Jev evaluates the questions in a request independently, so we sent the whole panel in a single request per example. The base run of 8,801 requests came to about 2.9 million input tokens, roughly $0.12 at TypeSafe's published $42 per billion, with a median latency of 0.24 seconds. The eight-question panel cost about $0.21 for the whole dataset. Those are our estimates from token counts, and they cover model charges only. The model version was jev-1.13.0.
Everything is in the Jev-Calibration repository, including Jev's raw responses, so you can rerun every chart without an API key.
Higher confidence does mean more likely right
The most important result is that Jev's confidence sorts right answers from wrong ones well. One way to measure that is AUROC: pick one correct and one incorrect answer at random, and ask how often the correct one had the higher confidence. A coin flip gets 0.5.
On the same 1,000 examples our earlier work ran through Llama 3.1-8B, Jev's confidence scored 0.83, against 0.72 for Llama's log-probability-based confidence. Without the neutral tier, it was 0.90 against 0.76. That comparison is against the base Llama model, not the fine-tuned one, with different prompts, so read it as the same data through two different systems.
And the pattern is visible in the raw buckets. For Noul, accuracy climbs from 47.6% for answers stated at 50 to 60% confidence to 100% above 95%.
But the numbers aren't probabilities of being right yet
Ranking well doesn't mean the stated confidence matches the observed accuracy. Averaged over all 8,801 examples, Noul's mean confidence was 79.0% against 72.3% accuracy: about 7 points overconfident. Choice's was 91.4% against 76.1%: about 15 points. Without the arbitrary-label neutral tier those gaps shrink to about 1 and 9 points. So Noul is modestly overconfident, and Choice is clearly overconfident.
The averages hide where the trouble is, and it's different for each question type.
Noul: solid at the extremes, shaky in the middle
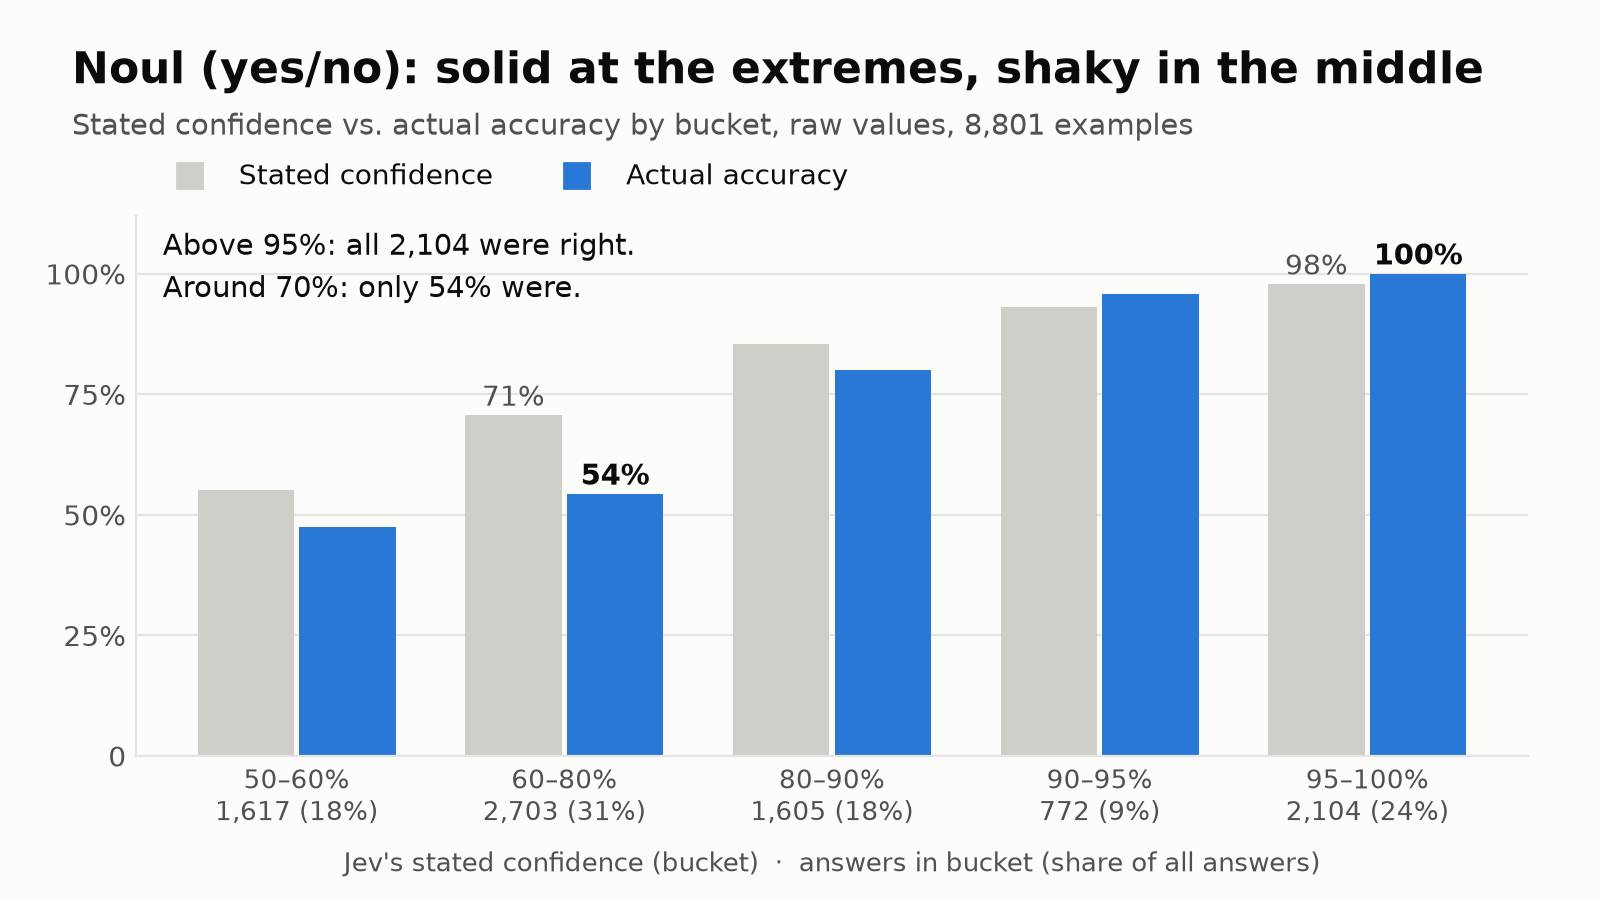
Noul, raw values, all 8,801 examples. Grey bars are what Jev stated; blue bars are how often it was right. Under each bucket: how many answers landed there, and their share of the total.
Every one of Noul's 2,104 answers above 95% confidence was correct, and nearly all of them were the strong and medium examples: 978 strong, 1,083 medium, 42 weak, and one neutral. Between 90 and 95% it was 95.9% accurate, better than it claimed.
The middle is where it goes wrong. In the 60 to 80% bucket, the average stated confidence was 70.7% and Jev was right 54.3% of the time. Weak and neutral examples account for 1,636 of the 1,637 errors among the 3,428 answers with 55 to 80% confidence.
Choice: close to a coin flip until 95%
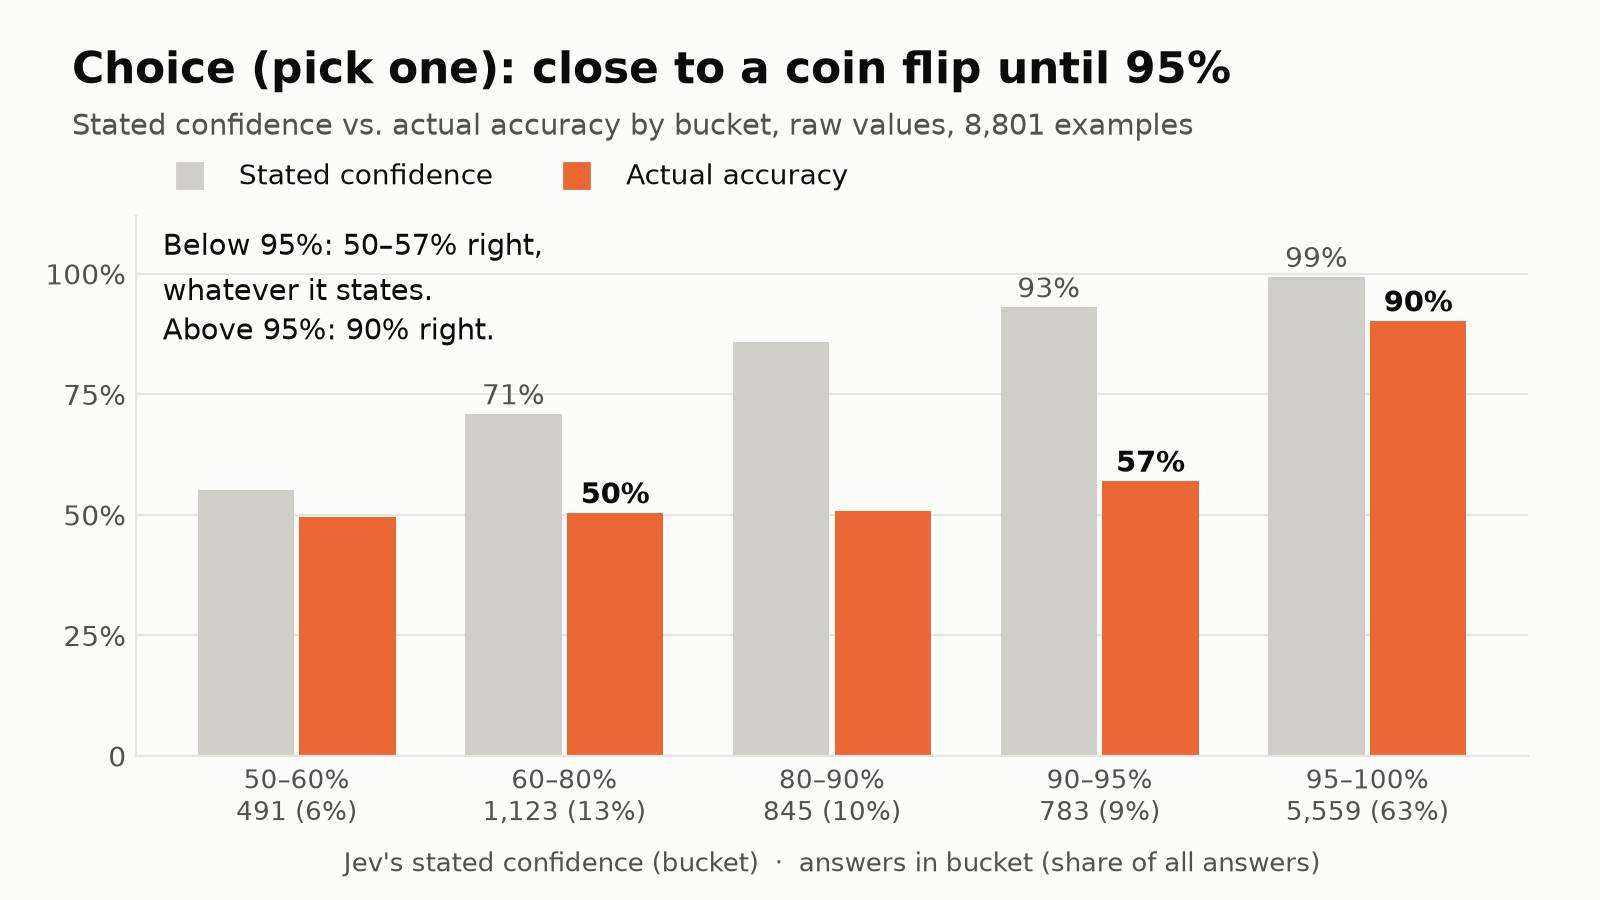
The same view for Choice. Below 95% stated confidence, accuracy hovers between 50% and 57%, whatever number Jev states.
Choice tells a different story. From 50% to 95% stated confidence, it was right 50 to 57% of the time, so the stated number carries almost no information. Only the top bucket is informative, and it's huge: 5,559 answers, 63% of everything. There, Jev's average stated confidence was 99.4% and its accuracy was 90.2% (96.1% without the neutral tier). Unlike Noul's top bucket, it includes plenty of ambiguous text: 2,276 weak-tier examples and 769 neutral-tier ones. Choice hands out near-certainty freely.
If you take one practical point from this section: on this data, Noul's raw confidence above about 90% held up, and Choice's raw confidence below 95% told us almost nothing. Even Choice's top bucket overstates by about nine points (about three and a half without the neutral tier).
How you ask changes the answer
Those two patterns raised an obvious question: is it the question type or the phrasing? We had asked Jev the same sentiment question in eight ways and derived three more setups from the answers (an expected score and two averages), so we could check.
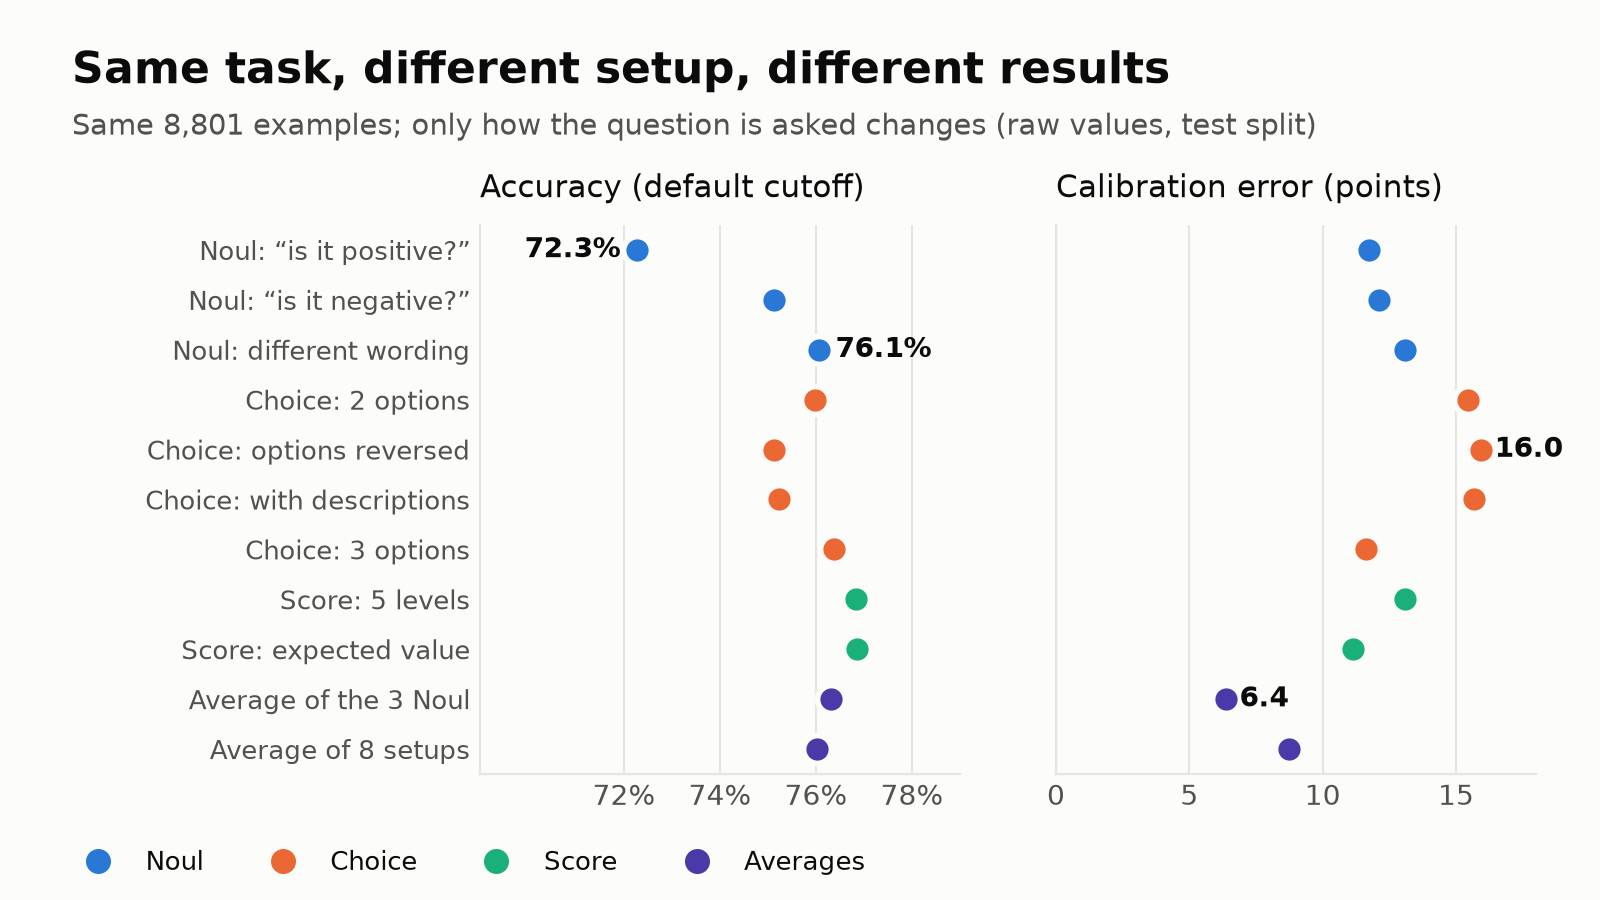
Eleven setups for the same question, raw values, test split. Left: accuracy at the default 0.5 cutoff. Right: calibration error of the raw P(positive).
Both measures moved:
- Accuracy ranged from 72.3% to 76.9% at the default cutoff. Rewording a single Noul question, from "is it positive?" to "does the writer express a favorable, approving, or satisfied attitude?", took it from 72.3% to 76.1%. That's a real difference (the first is significantly worse than the two-option Choice, paired exact test p = 6×10⁻⁶) while the reworded one ties it (p = 0.95). The spread across three Noul wordings is as large as the gap between the two question types, so phrasing matters as much as type.
- The differences all live in the weak tier. Strong (1.000), medium (about 0.997), and neutral (about 0.50) are the same for every setup. Much of the gap is the cutoff: the first Noul under-calls "positive", and once we pick the cutoff on the calibration set, the setups land within about three points of each other.
- Raw calibration error ranged from 6.4 to 16.0 points. Averaging several framings gave the best raw calibration, and the two-option Choice variants gave the worst.
Reversing the order of Choice's options changed accuracy by under a point. The same Noul question asked inside a different request differed from its earlier answer by 0.007 on average, so the results aren't an artifact of what else is in the request.
The takeaway: the setup is part of the classifier. Report accuracy with its wording and cutoff, and don't assume a calibration you learned for one setup applies to another. That last point is our inference from the fitted curves differing across setups, and we haven't tested reusing one calibration on another.
Calibration fixes it
Calibration learns a mapping from Jev's raw probability to how often that probability was actually right, fitted on the calibration set and scored on the test set. We tried the two standard methods. Platt scaling fits a smooth logistic curve with two parameters. Isotonic regression fits any never-decreasing step function to the data.
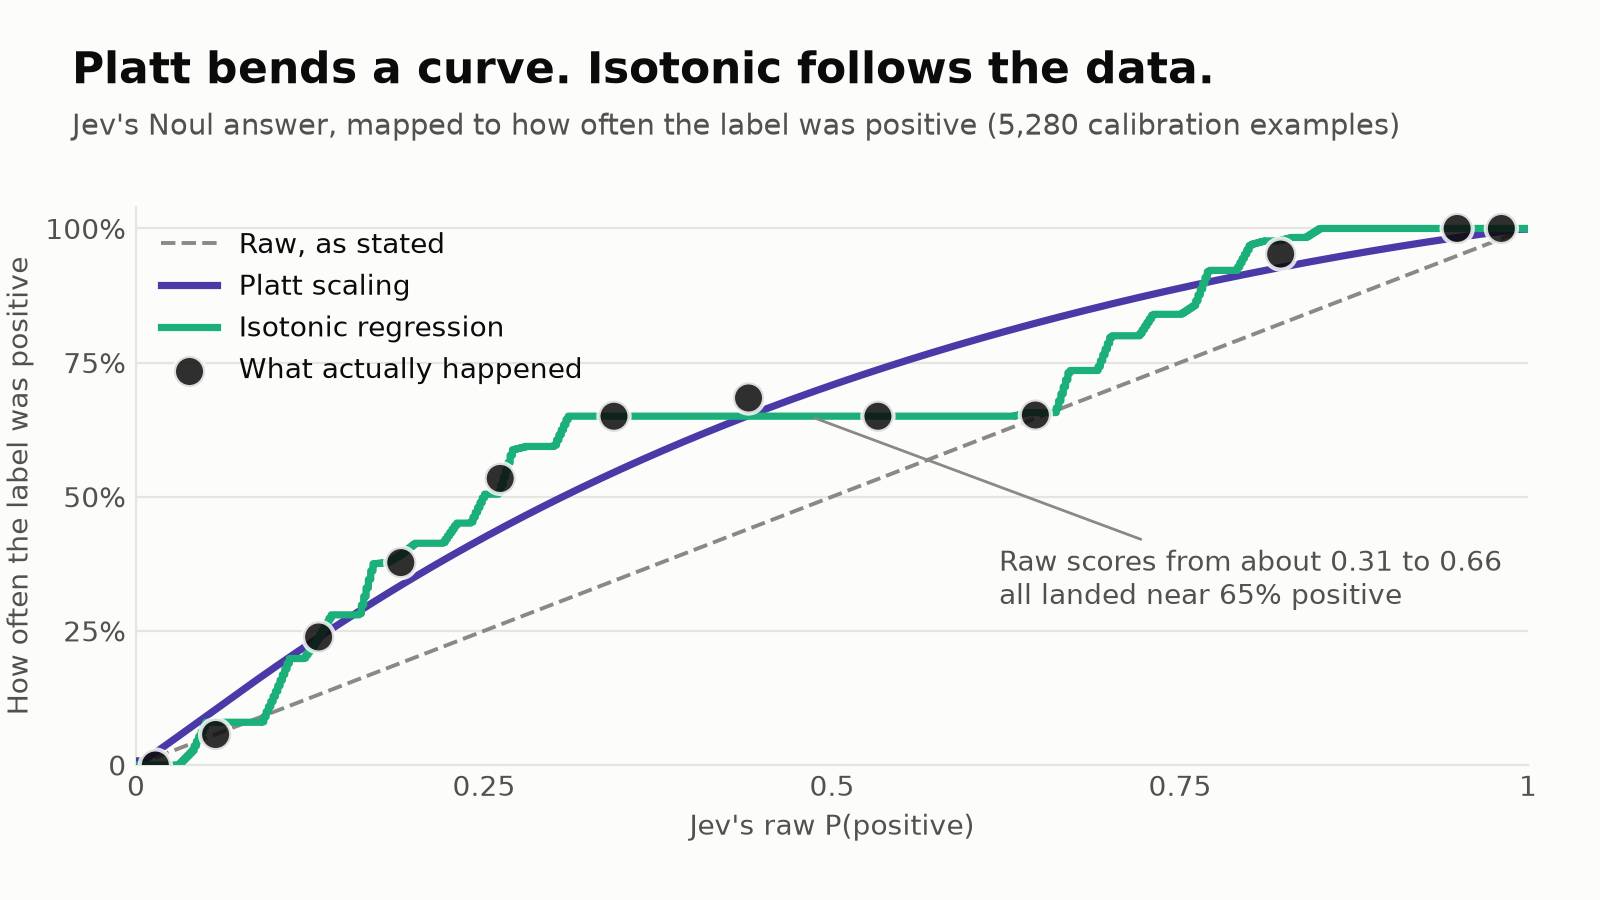
What each method does to Jev's Noul answer. The dots are what actually happened. Isotonic follows the plateau; Platt bends through it.
There's a plateau in the data. Raw scores from about 0.31 to 0.66 all corresponded to roughly 65% positive labels. A smooth sigmoid can't bend that way, so Platt splits the difference and misses at both ends. Isotonic follows the data.
For the Noul question on the test set:
| ECE | Brier score | Log loss | |
|---|---|---|---|
| Raw Jev | 0.117 | 0.162 | 0.467 |
| Platt scaling | 0.052 | 0.143 | 0.420 |
| Isotonic regression | 0.008 | 0.138 | 0.401 |
Neither method changes which answers rank above which, so accuracy and AUROC barely move. Calibration makes the number mean what it says, and it can't add information the score doesn't contain.
This is the mechanism a production confidence-gated system runs on: fit the calibration curve, set a threshold in calibrated terms, and let everything above it go straight through while everything below routes to a reviewer. The curve just has to be calibrated, because the reviewer catches what falls under the bar.
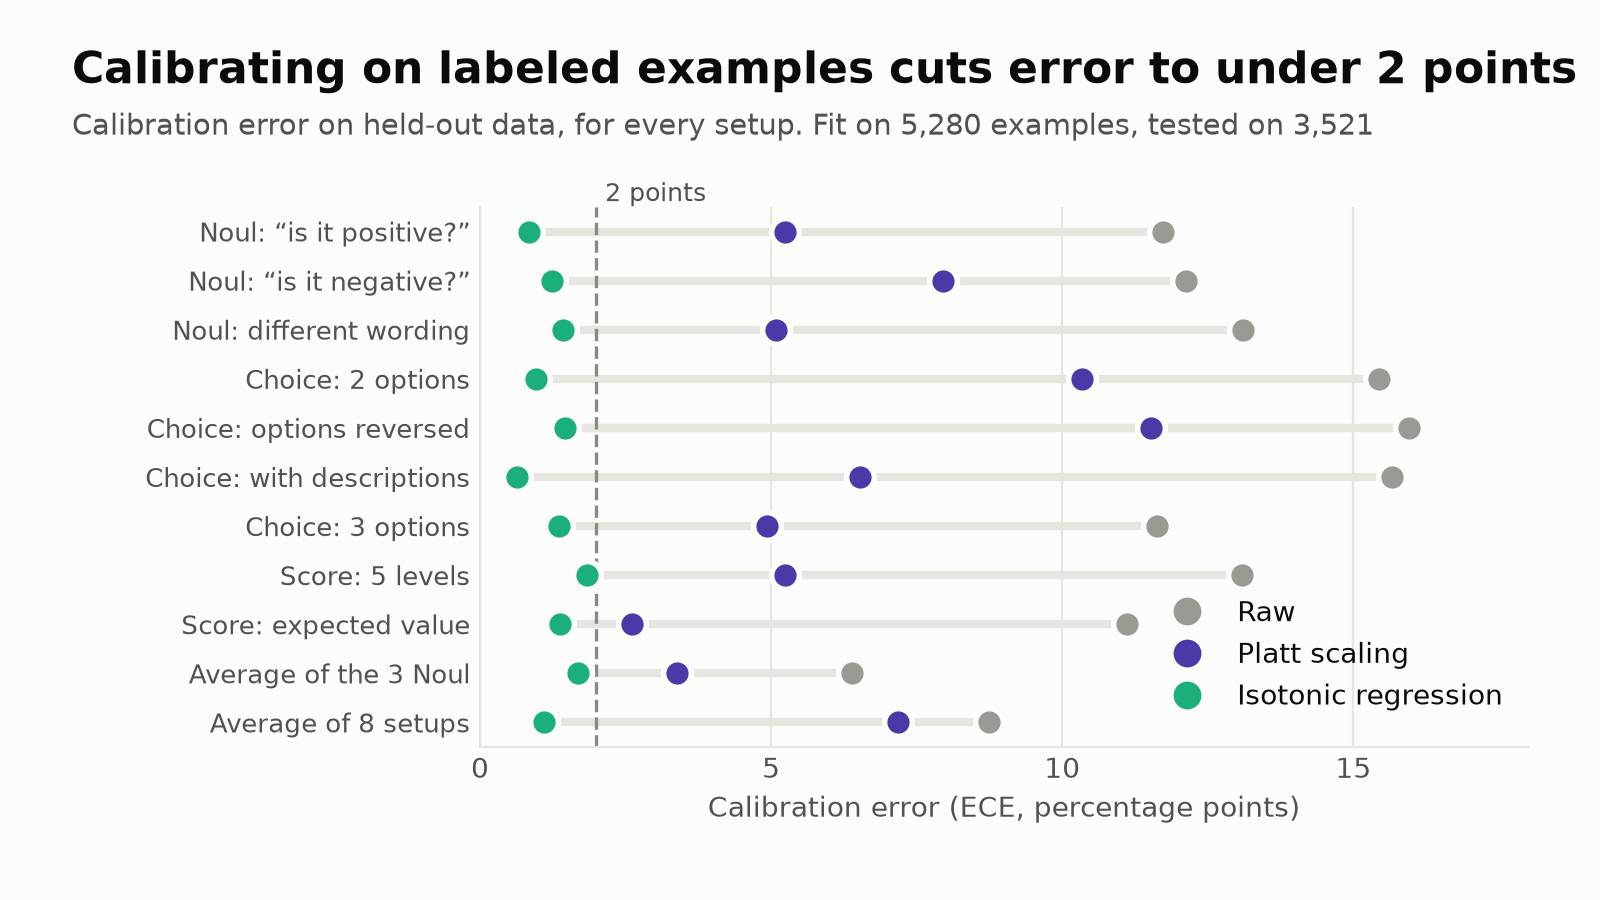
Calibration error on the test set for every setup. Isotonic regression brought all eleven under two points.
That held for every setup. Raw ECE ranged from 0.064 to 0.160, Platt from 0.026 to 0.115, and isotonic from 0.006 to 0.018. Once calibrated, the way you phrase the question matters much less for calibration error, though the ranking quality still differs a little.
How much labeled data do you need?
The usual advice is that isotonic regression is data-hungry and Platt is the safer choice for small calibration sets. We tested it: draw n labeled examples from the calibration set, fit both methods, score on the test set, and repeat 200 times per size.
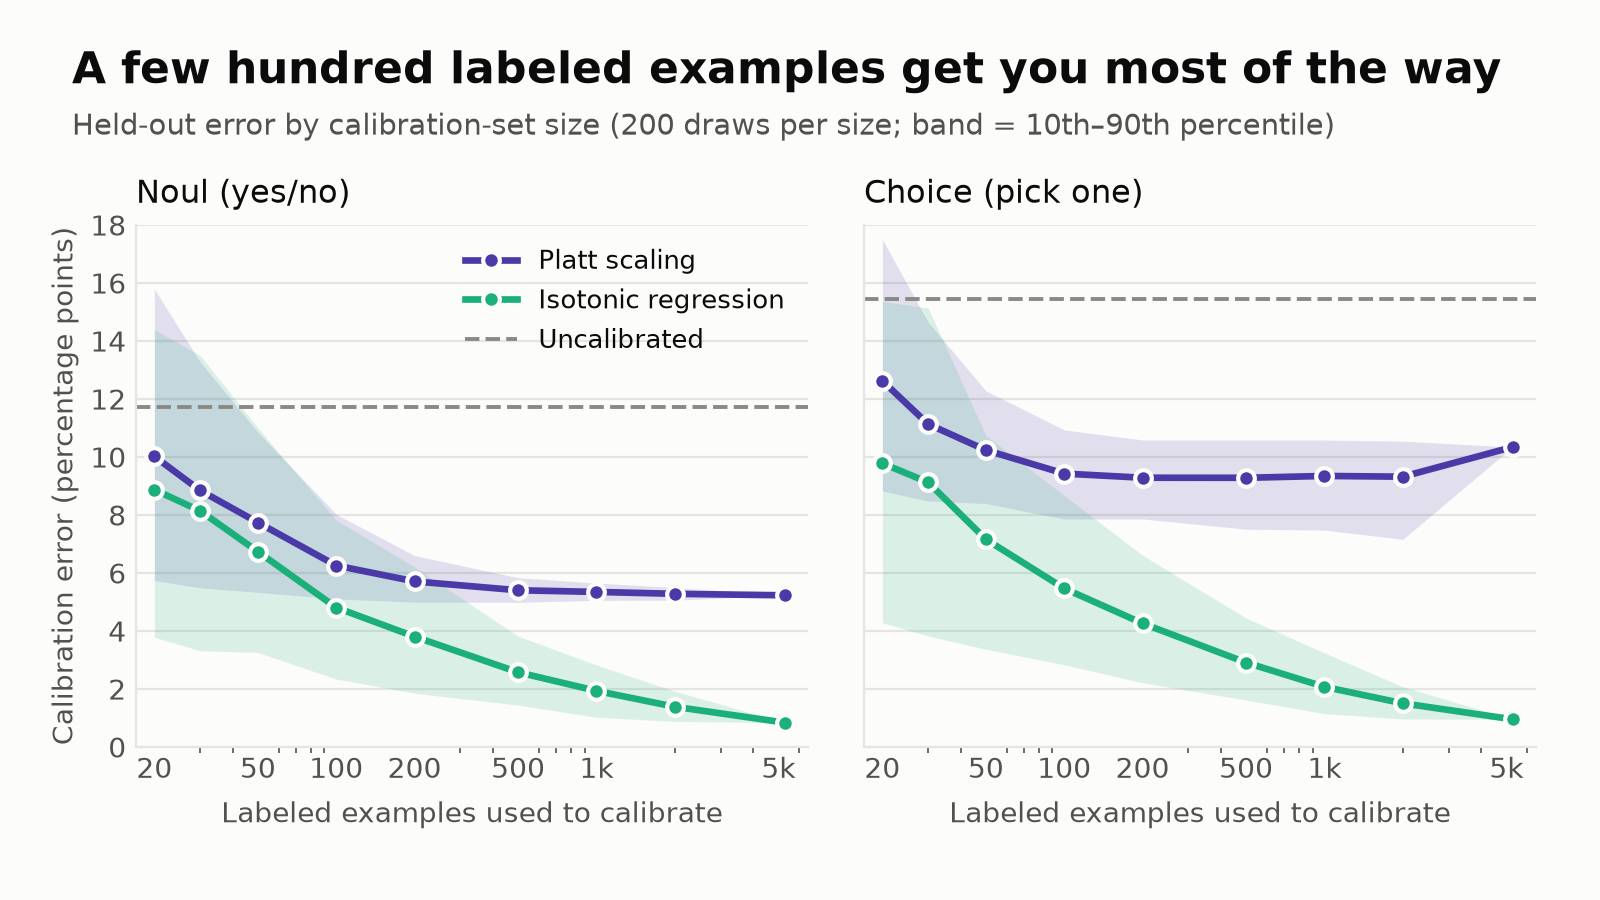
Calibration error as the calibration set grows, for Noul (left) and Choice (right). Lines are averages over 200 random draws; bands span the 10th to 90th percentile.
The advice didn't hold on this data. For both question types, isotonic matched or beat Platt on average at every size from 20 to 5,280 examples. Platt flattens out by about 200 examples: its shape is wrong for this data, and more examples don't fix that. Isotonic keeps improving and hadn't stopped at 5,280. With 200 examples, isotonic error on the Noul question averaged 3.8 points against 5.7 for Platt; with 500 it was 2.6 against 5.4. On Choice, Platt never got below about 9 points.
Below about 50 examples, both are noisy, and one unlucky draw can be worse than not calibrating. A few hundred is enough to get most of the benefit.
A few hundred labels is also the number we've found holds up in production: enough to fit a calibration curve you can trust, without asking a reviewer team to grade a dataset before the system does any real work.
What we'd do with this
- Pick the question setup first, and treat its wording and options as part of the model.
- Label a few hundred examples from your own data, including the ambiguous ones. The results above depend heavily on how many hard cases there are.
- Fit isotonic regression on part of them and check it on the rest.
- Set thresholds in calibrated terms. "Accept above 90%" then means the accepted answers are right about 90% of the time. This is how we route work in production: the confident majority clears automatically, and a reviewer only sees the calls that need a person, which is what lets a QA operation cover far more calls than a sampled audit. On the non-neutral examples, ranking by calibrated confidence let us auto-accept roughly 65 to 74% of decisions at 95% accuracy or better, depending on the setup. That range is sensitive to ties, because Jev rounds its probabilities to two decimals, so we wouldn't quote a precise figure.
- Refit when the wording, the data source, or the model version changes.
What we haven't tested
- One constructed sentiment dataset and one model version. This isn't a real call-QA scorecard. The band-level patterns are more likely to carry over than the averages, which depend on our tier mix.
- Many comparisons on one test set. Picking a best setup out of eleven candidates from the same test data is optimistic, and we haven't computed confidence intervals. The gap between Platt and isotonic is large enough to trust. The ordering among setups is weaker evidence.
- Fine-tuned and hosted models. We compared against base Llama 3.1-8B only. We've seen concentrated log-probabilities from some commonly used hosted models in our own production work, as we noted in the last article, but we didn't rerun that comparison here, so this piece makes no claim about them.
- Jev's own
confidencefield. For a two-option question it's2·p_top − 1. That measures how peaked the distribution is and isn't a probability of being right, so we worked with the top probability instead. It may behave differently with more options.
The next test is the one we proposed last time: put Jev against a scorecard we understand, in shadow mode, with expert-adjudicated calls. If the calibration holds there with a few hundred labeled examples, the case for running whole scorecards through it gets a lot stronger.
Until then, the answer to the question in the title is: yes, with a calibration step. Jev's confidence is informative out of the box, but it's a ranking until you check it against your own labels, and it's worth checking every time you change how you ask.
We run this calibration loop for clients, at scale
This dataset and this test set are the small, reproducible version of a calibration loop we've run in production for years. A reviewer agrees or disagrees with a verdict, and that label refits the curve; when a reviewer's comment points at a pattern the model keeps missing, that pattern becomes a stated policy the system checks going forward. We've run that loop for a call-center QA operation across hundreds of scorecards and millions of interactions, and it's the case study behind the coverage numbers a calibrated confidence threshold makes possible.
Plexus is where we run it: the calibration, the auto-accept thresholds, the reviewer workflow, and the audit trail behind every promoted change.
If you're routing decisions on a model's confidence and want to know whether your threshold means what it says, we'll calibrate it against your own labels. The whole loop, with the published measurement behind each step, is on the decision models page. The calibration half of that loop is open source as Cyclotron: it fits a small model on your reviewers' corrections and reports its confidence against the real hit rate. Here's how an engagement works.
We do this for clients, at scale
Anthus has run this kind of loop in production for years: reviewers correct the model and say why, the explanation becomes policy, and the system gets more trustworthy month over month across hundreds of scorecards and millions of interactions. Bring us the judgment task and we'll run it on Primus with your reviewers in the loop, and hand you a scorecard you can inspect after the first month.
See how an engagement works